

In this module, you can import 2 sets of point data. That is ground levels and formation levels data defined in CSV file and generate area and volume reports related to earthwork calculations by specifying the grid interval. This module is very helpful if you want to find out quantities for grading or leveling projects. You can generate quantity reports either by creating cross section drawings (automatic) at specified grid spacing or you can compute the volume by the block method. In case a formation level is to be achieved as a single plane, then you can specify the formation level and can estimate the quantities and respective drawings can be generated.
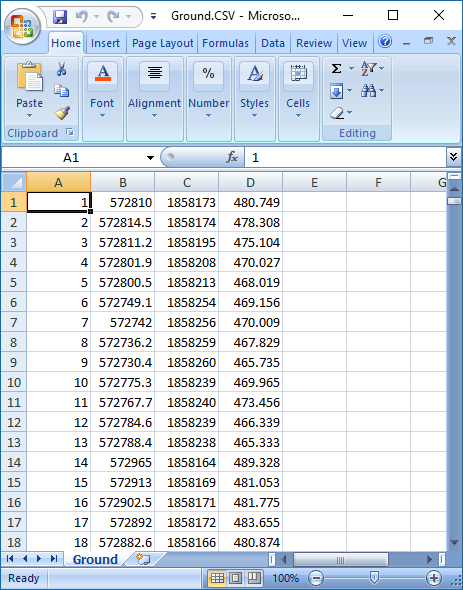
CSV file containing point data. In CSV file Easting (X), Northing (Y) and Elevation (Z) Co-ordinates are expected in the Input File. CSV File may contain additional column data like Serial Number, Code (Remark) but, having X (Easting), Y (Northing) and Z (Elevation/Level) data is mandatory. It may be kindly noted that the units are to be only in the metric system. In the CSV file Eastings, Northings and elevation are required to be in Meters only.
Example CSV File
Earthwork Calculation is always done between 2 surfaces. You can have point data in the similar format as explained in the previous paragraph for both the surfaces or if you have a constant formation level for one surface then point data of one surface is sufficient.
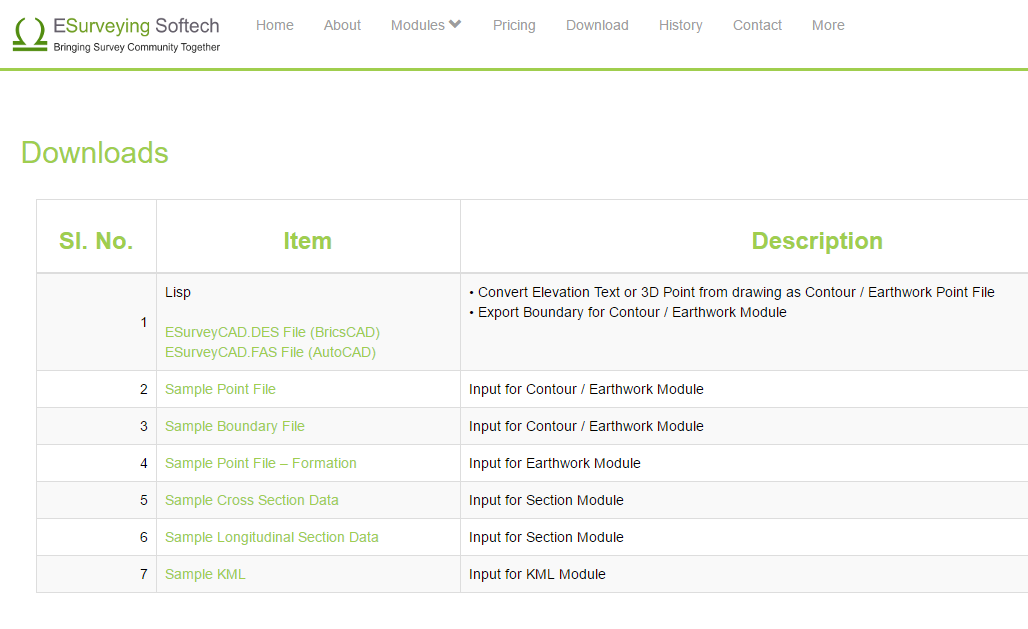
Although this is not compulsory to give boundary data, we strongly recommend you to provide the boundary definition file as input for better results. You can create the boundary definition file from your CAD drawing using the free lisp program provided in the download section.
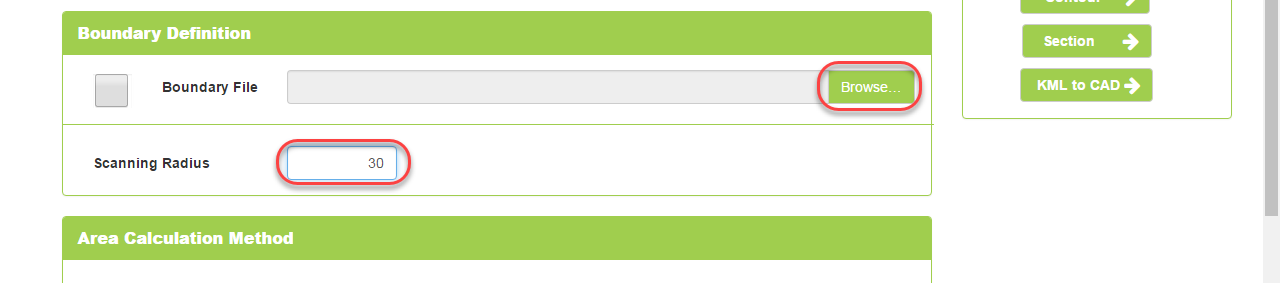
If you don’t have boundary definition file, you can give a factor called Scanning Radius to help the application prepare an approximate boundary. You have to specify Scanning Radius as a factor which indicates approximately at what distances your input data is captured.
The online application will not generate the earthwork quantity reports for any input given. Before processing the file following limits are checked and only if input data is within specified limits, then the process will continue.
Once you are ready with input files. Login to www.esurveycad.com with your email id and respective password.
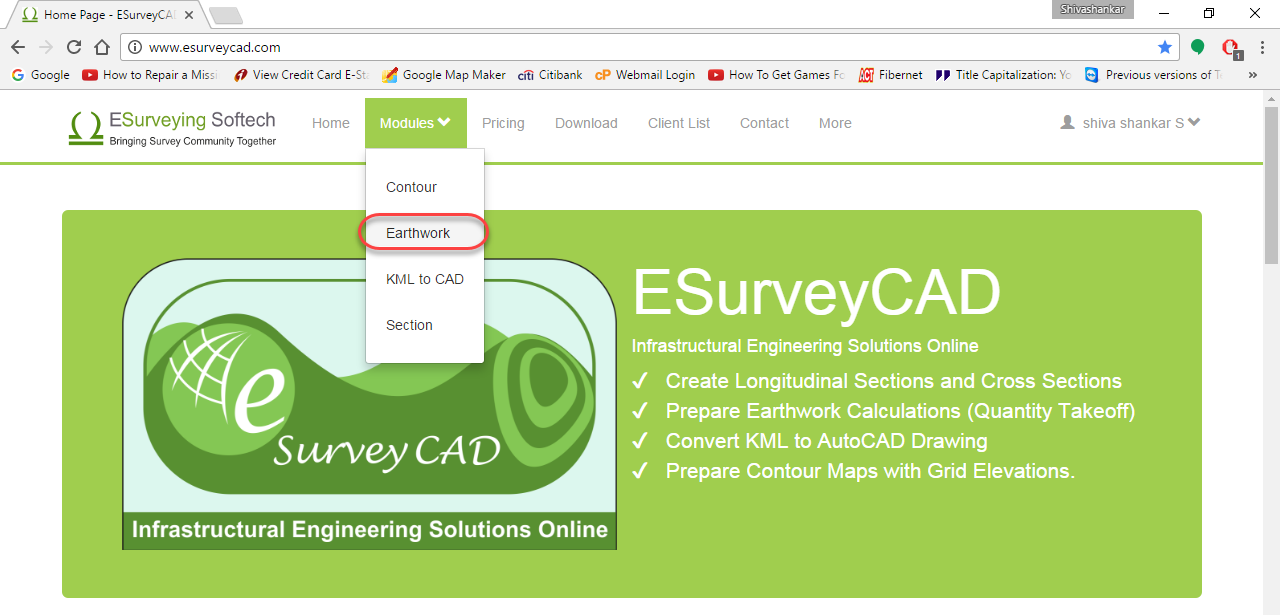
Select Earthwork Option from ‘Modules’ drop down menu.
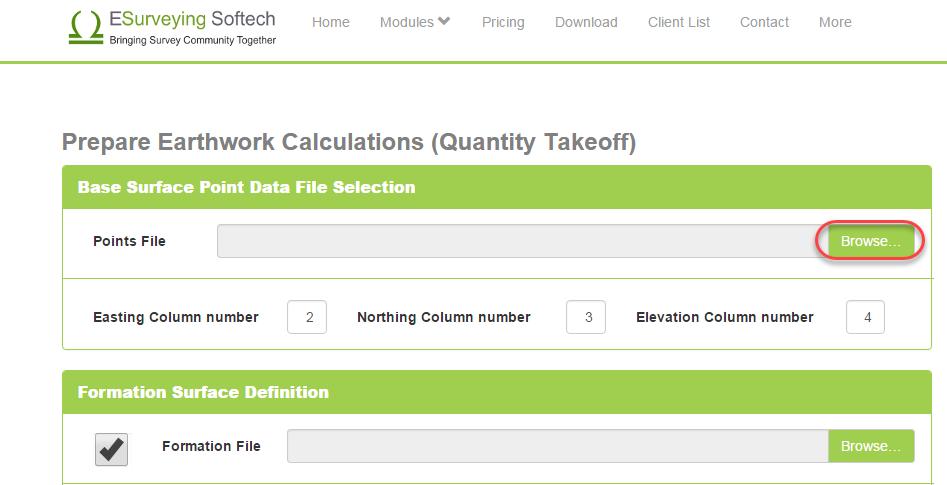
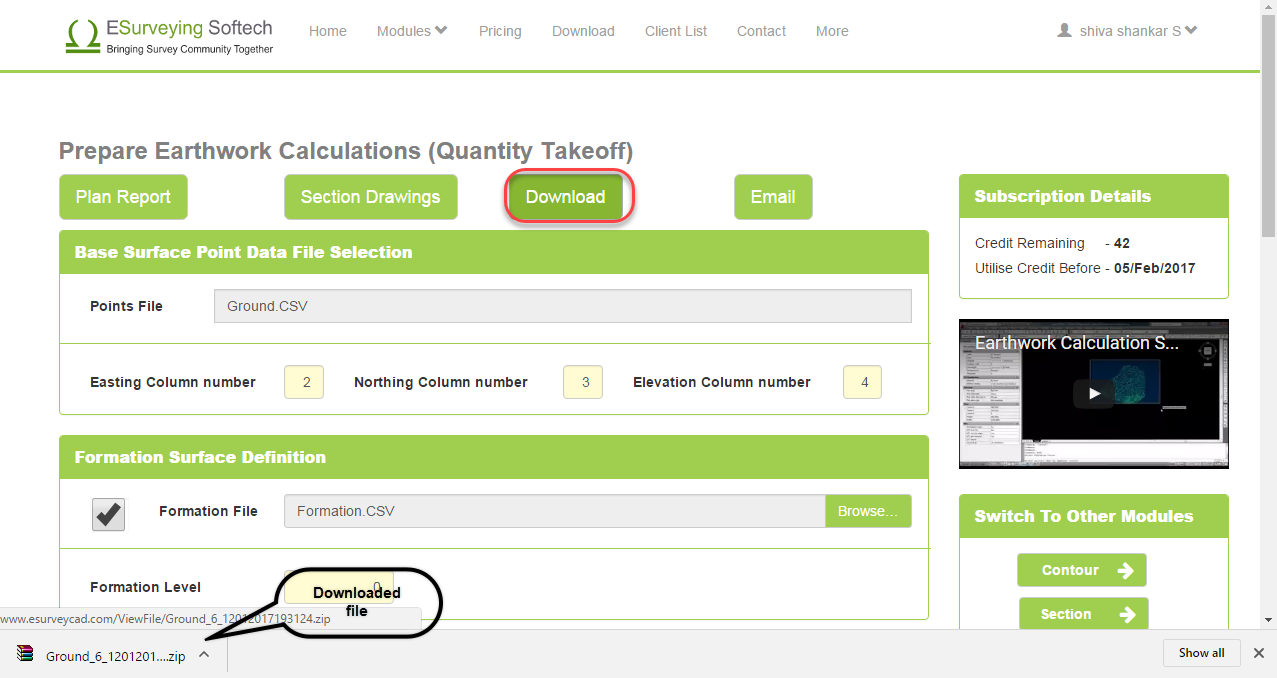
Click on Browse button and locate the CSV file from your computer having point data of base surface (Ground Levels). Depending on your CSV File mention the column numbers in which Easting (X), Northing (Y) & Elevation data are present.
Sample Ground.CSV file
Note:If you have elevation data in a drawing, please download ESurveyCAD lisp from the download section and load in your CAD package then, run “EXPD” command to create a CSV File (Point Data) from your CAD Drawing.
If you have constant formation level specify the same in the Formation Surface Definition group. If you have point data for formation level also – Select the point data file as you did in the previous step. Note that you have to have Easting (X), Northing (Y) and Elevation (Z) in the same column as in the base surface.
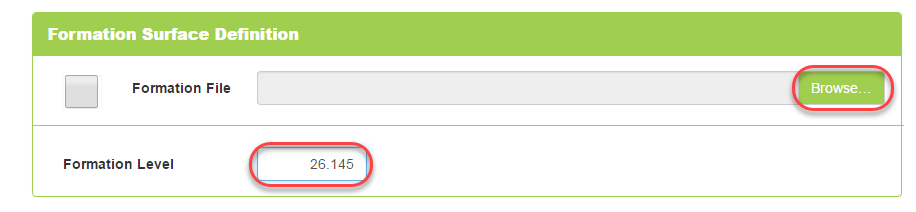
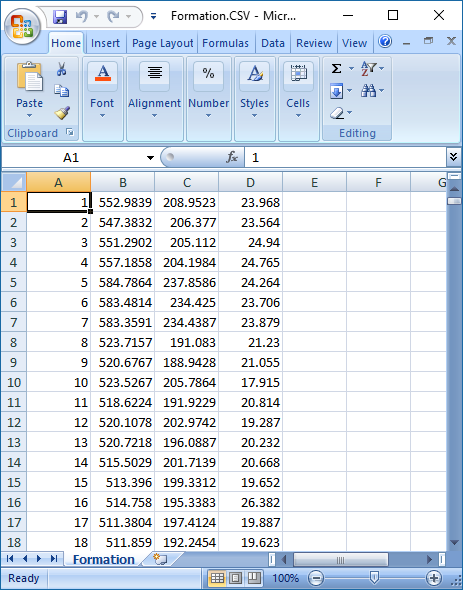
Sample Formation.CSV file
If you have the boundary definition file, select the same using Browse button. If you have a boundary in CAD use ESurveyCAD Lisp and run “ExBound” command to generate the boundary file. In case if you don’t have boundary definition and expect the software to create a rough boundary then specify Scanning Radius (Approximate Average Distance).
Sample Boundary.CSV file

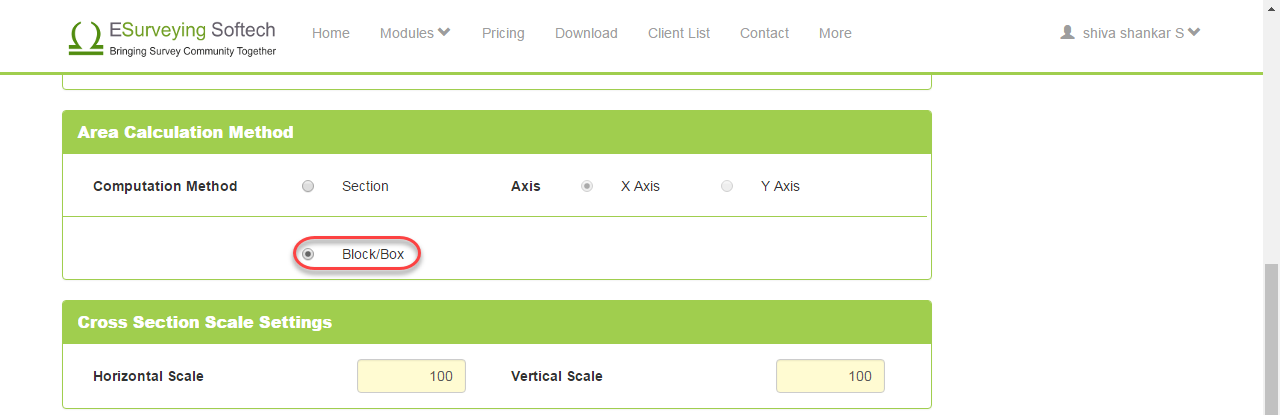
In Area Calculation method setting
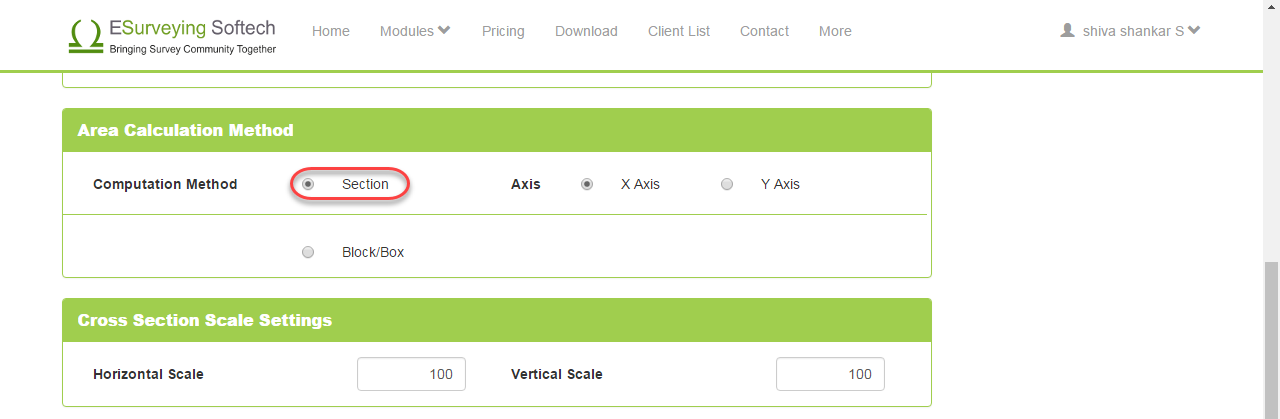
If you select section method, you need to specify whether you want cross section to be plotted along the X Axis or along the Y Axis.
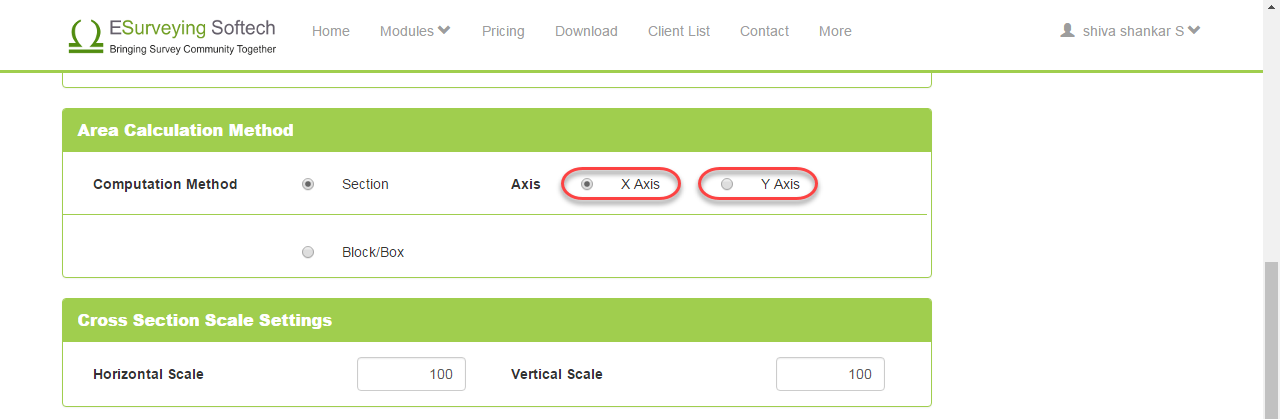
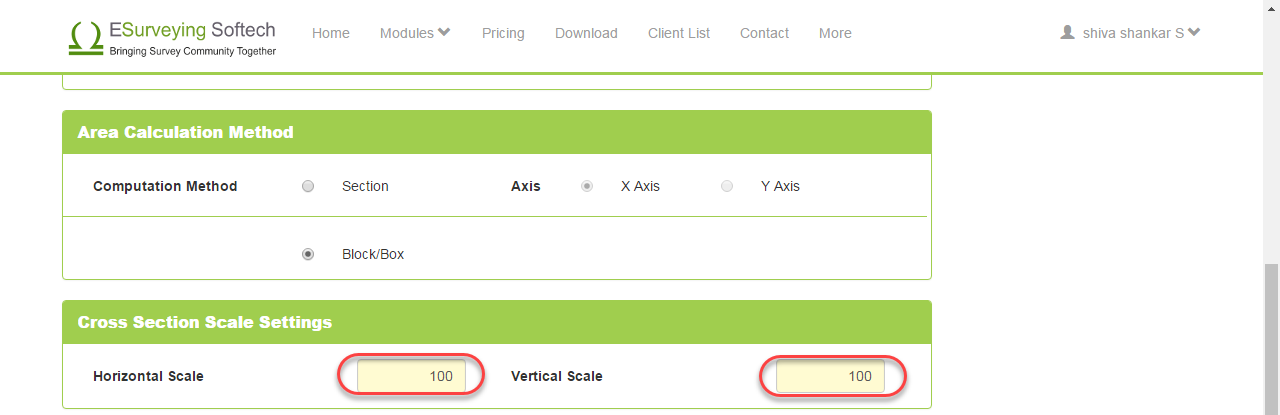
In Cross Section scale Setting, Specify the horizontal and vertical scale factor.
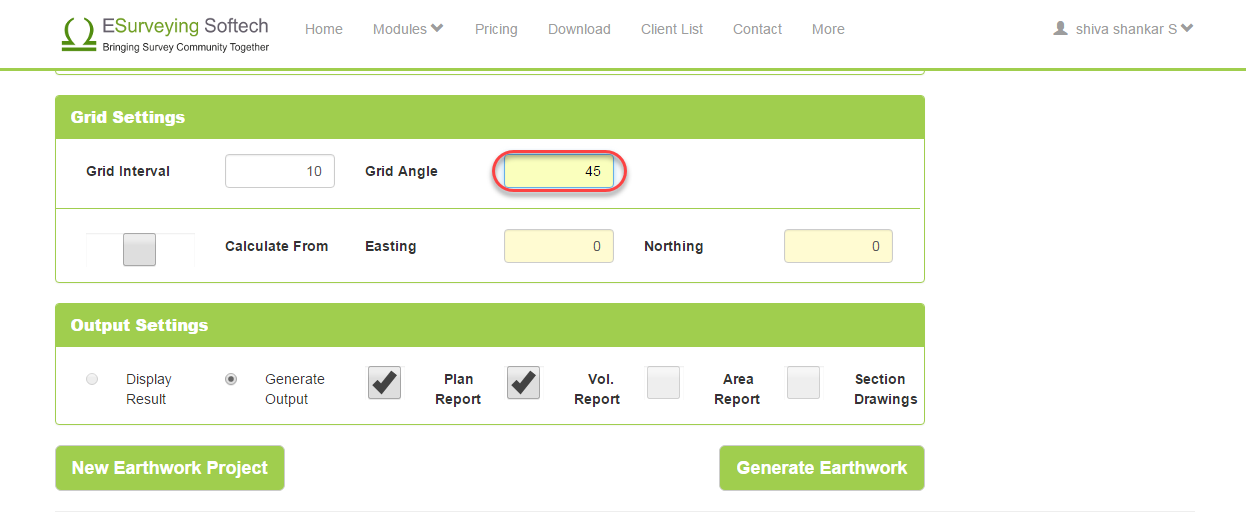
In Grid Setting, Specify the grid interval of your choice. Normally 5 M or 10 M is preferred in most of the earthwork calculation projects as grid interval. By default software will compute grid with 0,0 as the base co-ordinate. If you want to shift the grid lines to some other reference point, specify Easting (X) and Northing (Y) coordinates of that point on which the grid lines should pass through.
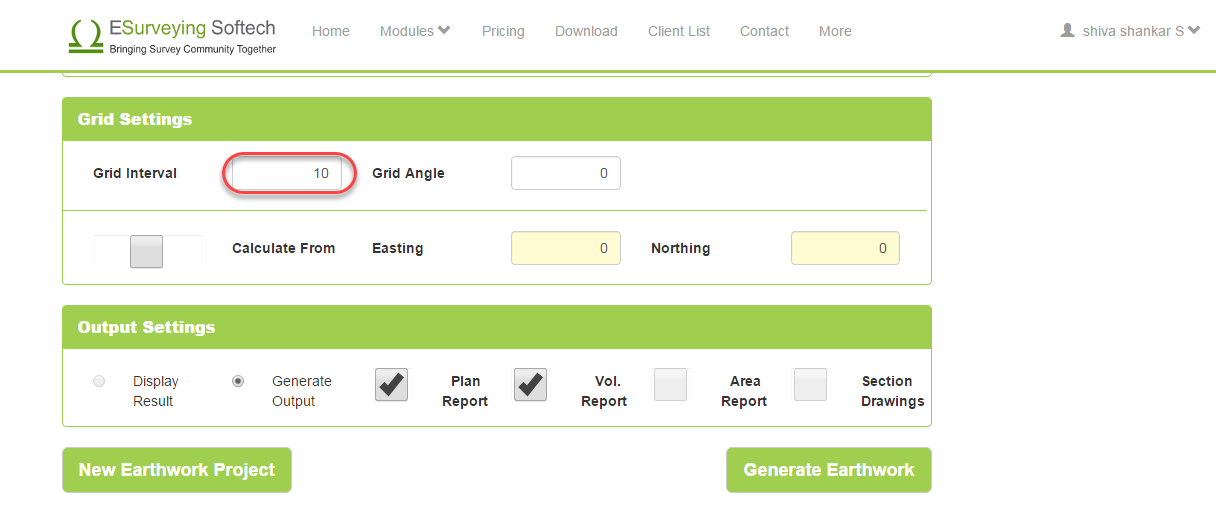
In case if you want the grid lines to be drawn at an angle, Specify the same. Value need to be between 0 and 90 degrees.
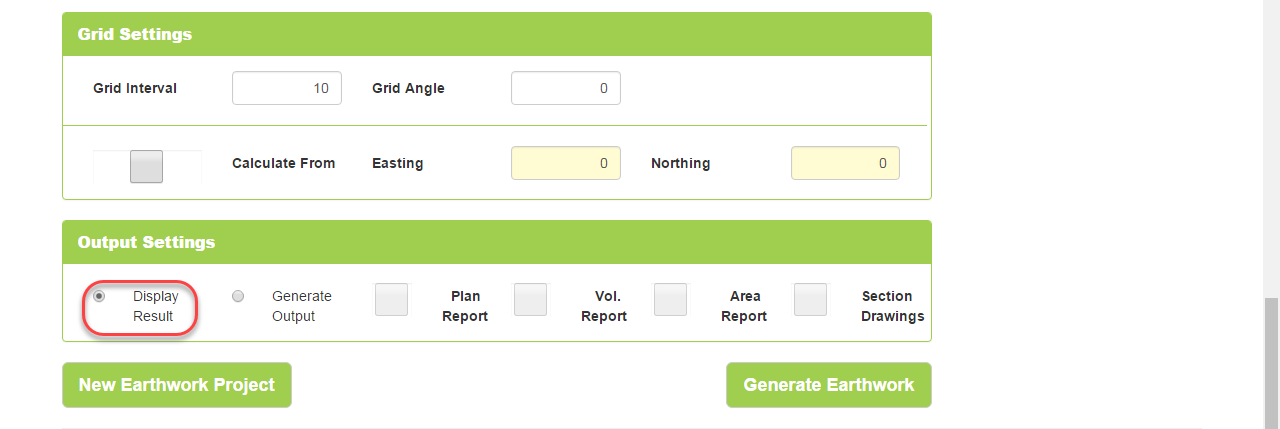
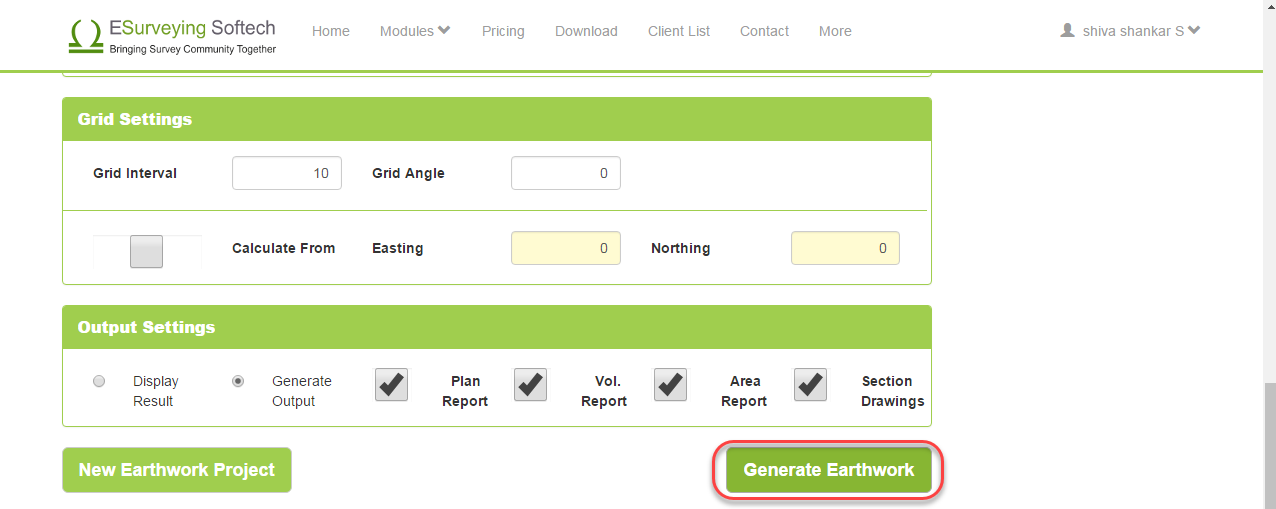
You can just see the volume result on screen or you can generate the drawings and reports for further use.
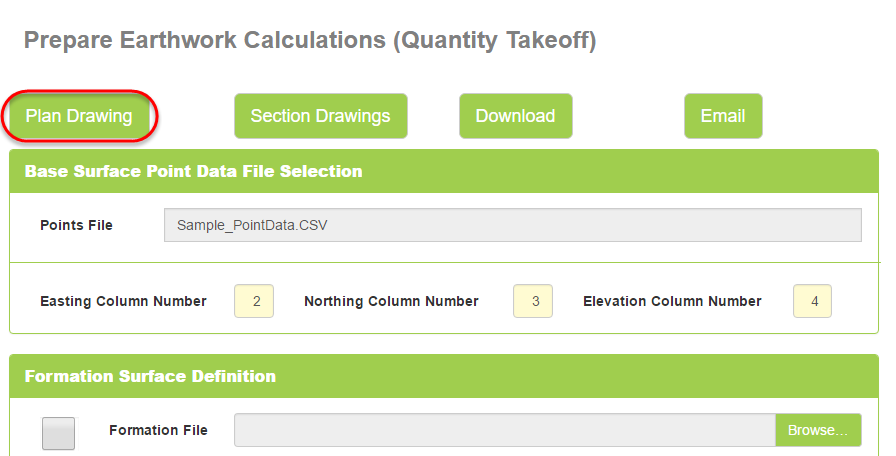
Click on Generate Earthwork, once the point data is processed and then drawings and reports are generated, Software will show 4 more Buttons on top of the screen.
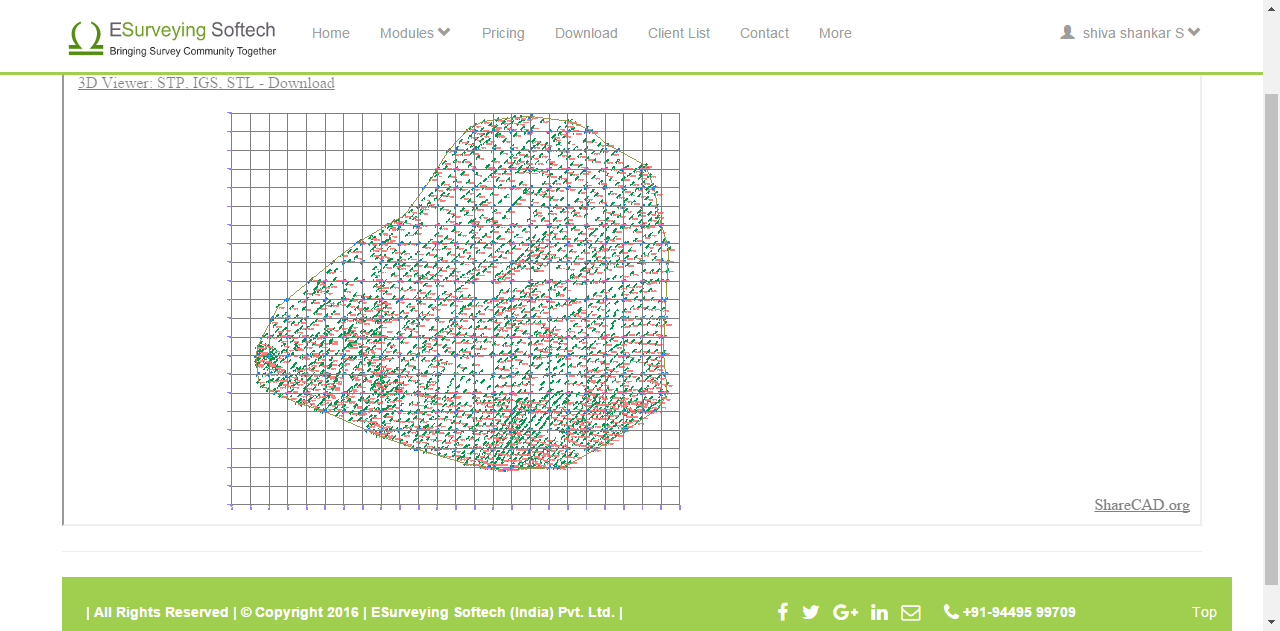
Click on Plan Drawing Button to view the Plan
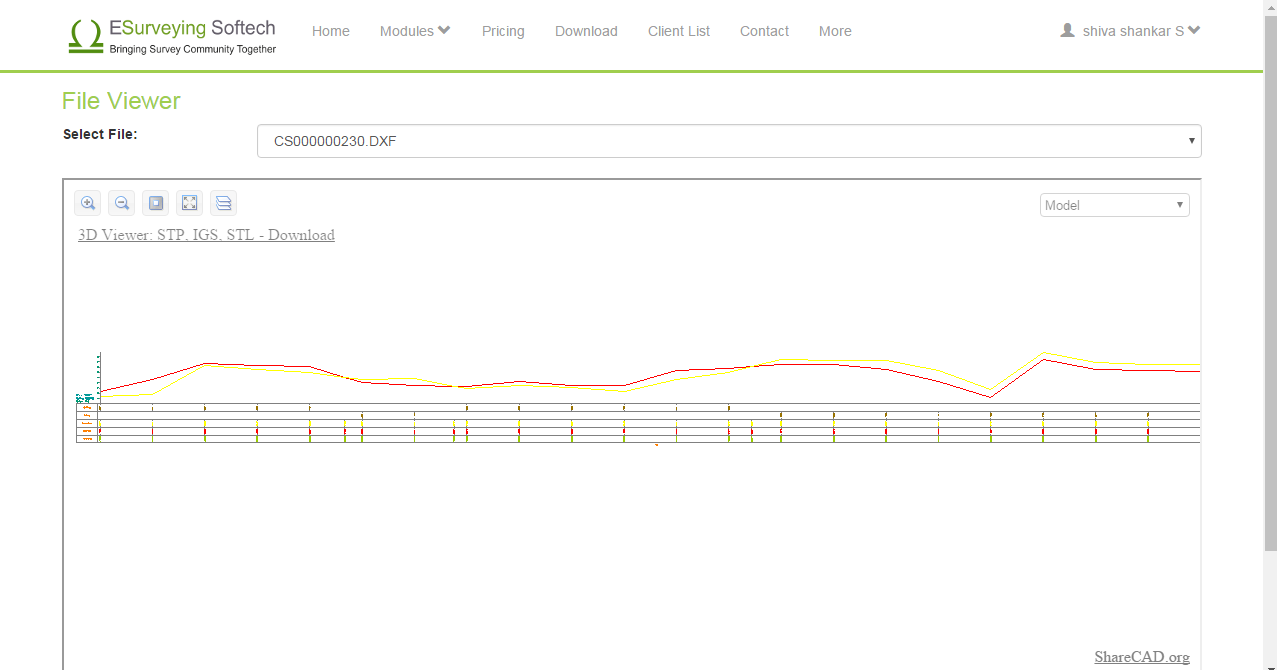
Click on Section Drawings button to immediately see the generated section drawings.
Click on the Download button, In case if you want to download the drawing
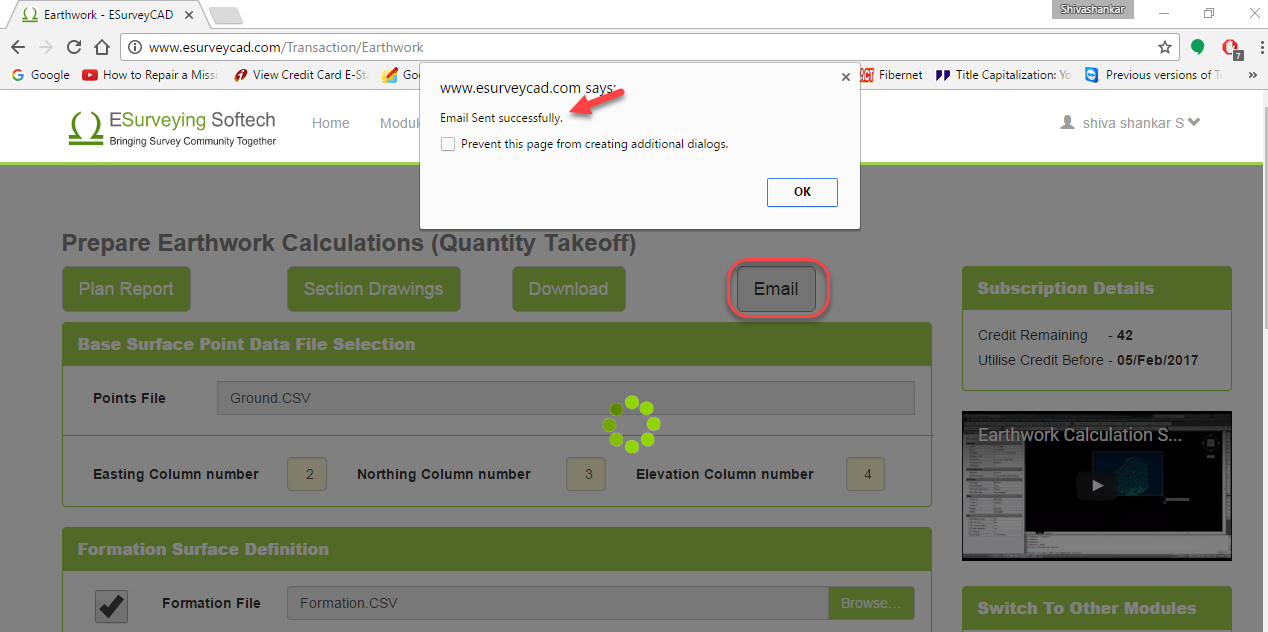
Click on Email button, In case if you want to download the drawing later. When you chose this option, file link is emailed to you. Please note that you have downloaded the required file within 24 hours. Later these drawings are deleted for ever from the application.
Terminologies
It is common practice to represent the lines in survey drawings with lines at an equal interval which looks like series of squares.
This interval depends upon,
When the original survey is done, normally points will be scattered (random). To make maps more readable elevations are interpolated at each grid line intersection. Elevations at these intersection points are called grid elevation.